We use cookies to make your experience better. To comply with the new e-Privacy directive, we need to ask for your consent to set the cookies. Learn more.
Arm DSTREAM
Support for Armv8
Debug and trace for Arm architecture versions v4 to v8. Whether it's legacy or the very latest, DSTREAM has it covered.
Lightning Fast
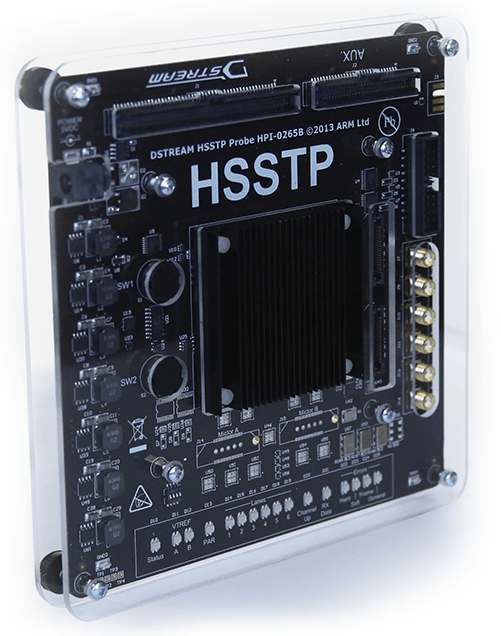
Parallel trace up to 9.6 Gbps, or serial trace up to 20 Gpbs using the HSSTP Trace Probe.
4GB Trace Buffer
Capture extended trace even on the fastest targets to get a detailed picture of software execution.
Flexible Debug
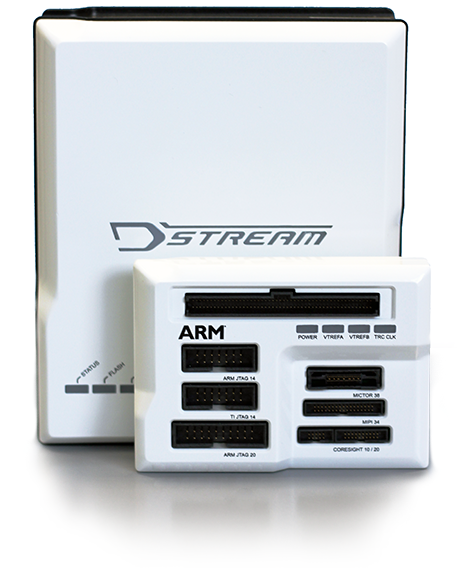
Adapter for JTAG, CoreSight, TI and MIPI. Compatible with 3rd party IP and debuggers to give you maximum flexibility.
Accelerated Development
FPGA acceleration delivers high download speeds and helps you step through your code super-fast on single and multicore devices. DSTREAM comes with an adapter for JTAG, CoreSight, TI and MIPI connectors to give you as much flexibility as possible, regardless of the device you are using in your project.
DSTREAM ships with powerful software utilities to assist with SoC bring-up and hardware validation. It also provides interfaces for third-party and custom tools. From initial development to device bring-up, make DS-5 and DSTREAM your debug solution.
High-bandwidth Trace
Trace is an essential tool for the resolution of complex software/hardware and timing-related issues, as it enables post-analysis of a software execution without the need for any software or hardware instrumentation.
The 4 GB trace buffer on DSTREAM enables high-bandwidth trace for long periods, providing further visibility of how the software executes on the target.
Trace can either be collected using the default parallel trace probe supplied with DSTREAM, or alternatively, using the High Speed Serial Trace Probe (HSSTP), available separately. This allows for high bandwidth serial trace capture of up to 20 Gbps from Arm HSSTP or Marvell® SETM.

ARMv8 Support
DSTREAM is designed with complex SoC bring-up in mind, so presents a complete solution to save significant development time when paired up with DS-5 Ultimate Edition and Armv8 SoCs. DS-5 comes with a debug configuration utility that autodetects common CoreSight components in your SoC, from Cortex-M series MCUs (which might be running power management for the SoC) to trace components and of course the main application processor. To complement this, we also provide a high-level abstraction layer (the debug and trace services layer - DTSL), which makes adding customized trace objects and catering for complex topologies significantly easier.
Used and trusted by our partners around the world for Armv8 development, DSTREAM and DS-5 Ultimate Edition, backed up with Arm expert support have been instrumental to complex Cortex-A53 & Cortex-A57 based SoC bring up. Contact Arm to learn how we can support you in your next SoC design process.
Debug Probe Software Utilities
Arm debug adapter products include powerful software utilities for SoC bring-up and interfaces for third-party IP support.
CoreSight Access Tool (CSAT)
The CoreSight Access Tool (CSAT) provides a scriptable low-level interface to a target’s CoreSight Debug Access Port (DAP), which gives access to on-chip debug and system buses. CSAT is useful to perform initial bring-up tests before a debugger connection to the target is available.
CSAT enables the configuration of third-party IP connected to the DAP, for example custom instrumentation hardware, and can be used while a debugger is connected to an Arm processor. This enables the debug of complex hardware-related problems.
Python Scripting
Arm target connection products implement powerful low-level target control via Python scripts. For example, this allows you to configure them to automatically refresh the watchdog timer while they are connected to the target, and work around hardware bugs.
DS-5 also uses Jython scripting for debug and trace configuration, making it simple to define complex trace topologies and helping you to route trace to DS-5.
RDDI API Compatibility
RDDI is the main set of C APIs between Arm debuggers and DSTREAM. RDDI contains several API sets and these are supported by DSTREAM as follows:
| RDDI API Class | Supported |
| RDDI-Config | Yes |
| RDDI-Browse | Yes |
| RDDI-JTAG | Yes |
| RDDI-DAP | No |
| RDDI-Debug | Yes |
| RDDI-Trace | No |
| RDDI-StreamingTrace | Yes |
Third-party debuggers or other customer-specific tooling, for both Arm and other processor cores, can connect to DSTREAM using the RDDI interface. Whilst RDDI is a C level API, other languages can be used, such as Java and Python. The firmware in DSTREAM has a flexible architecture to connect to multiple Arm and third-party IP cores on a SoC via a single debug interface.
RDDI is freely available from within the DS-5 installation.
A low-level RDDI connection to DSTREAM-ST can be used to gain access to the JTAG scan-chains inside the target device. This enables the unit to be used for simple tasks such as production testing and flash programming.
- Debug protocol: JTAG and Serial-Wire Debug
- Target connectors:
- 14-pin & 20-pin Arm JTAG
- 14-pin TI OMAP
- 10-pin & 20-pin high-density CoreSight connectors
- 38-pin MICTOR
- 34-pin MIPI
- 60-pin MIPI (QSH-60) via optional adapter
- 16-bit wide trace capture at 300 MHz DDR (600 Mbit/s per pin)
- Optional Arm HSSTP and Marvell SETM probe available separately »
- Interface Vref: 1 V - 5 V (configurable by target)
- See supported processor cores »
- See supported devices & platforms »
- Software Requirements: DS-5 (sold separately)
DS-5 Debug Probes Comparison
| Debug Probe | DSTREAM | DSTREAM-ST | ULINKpro family* |
|---|---|---|---|
| Functionality | Debug, Trace | Debug, Streamed Trace | Debug |
| Target type | Hardware | Hardware | Hardware |
| Cortex-A series support | All | All | Selected devices based on Cortex-A5 Cortex-A8 Cortex-A9 |
| Cortex-R series support | All | All | Selected devices based on Cortex-R4 Cortex-R5 |
| Cortex-M series support | All | All | Selected devices based on any Cortex-M |
| Arm11 series support | All | All | - |
| Arm9 series support | All | All | - |
| Arm7 series support | All | All | - |
| Maximum number of cores | 128* (See Cores + CoreSight devices limit) | 1022* (See Cores + CoreSight devices limit) | 4 |
| JTAG, SWD | JTAG, SWD | JTAG, SWD | |
| JTAG frequency (MHz) | 60 | 180 | 50 |
| 2500 | 12000 | 1000 | |
| On-target trace | Yes | Yes | Yes |
| Up to 16 pins | Up to 4 pins | - | |
| External serial trace | HSSTP, SETM | - | - |
| Trace buffer | 4 GB | None - streamed to host PC | - |
| Cores + CoreSight devices limit | 254 (up to 128 CPUs) | 1022 | - |
| Host connectivity | USB 2.0, Ethernet | USB 3.0, Gigabit Ethernet | USB 2.0 |
- Debug and trace on Arm processors from Armv4 to Armv8
- USB 2.0 and 10/100baseT Ethernet for direct or remote host connections
- Code download speeds of up to 2.5 MB per second
- Wide range of target connectors
- JTAG clocks of up to 60 MHz for lightning fast software upload
- Support for up to 254 CoreSight devices (including up to 128 CPUs)
- 4GB trace buffer for extended trace periods
- Flexible trace clock positioning relative to trace data
- Remote target reset
- Device bring-up and test utilities
- Trace port clocking modes: single and double-edge
- Flexible architecture to support 3rd party IP and debuggers
Tecnologix offers support which is directly handled by development team. Do not hesitate to get in touch with our experts.
Just ask here


